By Jeremiah Willett
In a previous article that I authored, titled Start Your BI Journey with a Data Model, I wrote about the importance of creating a data model at the beginning of the BI project. It is tempting to just load your data in your tool of preference (Power BI, Qlik, Tableau) and start creating dashboards with fancy visualizations without first building the data model. We now know that that will inevitably lead to broken dashboards, incorrect business decisions, data quality issues, and wasted time. So now that we have our data model, we can start building those beautiful dashboards, right? Not quite! Today we are going to talk about another critical step in the BI Journey: Hierarchies.
By creating a data model, we’ve successfully organized our business data into nouns (Dimensions like Products, Customers, Locations) and verbs (Facts like Sales Revenue, Quantities Sold). The next important step is ensuring that the user, especially the non-technical business user, is not overwhelmed by the nouns. A common mistake that happens right after the data model is built, is the developer creating dashboards that try to show every grain of detail at once on a single canvas. For example, a developer wants to show revenue across a company’s retail footprint in a Power BI report. To do this, they crowd the canvas with four separate charts: Sales by Region, Country, State, and Location. The result is a messy dashboard that could lead to cognitive overload for the target audience. This is where hierarchies come in.
Instead of scattering these concepts all over the canvas, we can nest them structurally within the Location dimension table and then use Power BI’s native drill-down filter feature to filter for each location level in a single prominent visualization in the dashboard. Creating hierarchies is incredibly simple in Power BI:
- Start in the Data Model view of your report.
- Find the Location dimension table and right-click on the highest geographic grain, Region, and select Create Hierarchy. Power BI will then create a new consolidated field named Region Hierarchy.
- Right-click on the next level down (Country), choose Add to Hierarchy and then select the newly created hierarchy, Region Hierarchy.
- Repeat this process for State and Location.
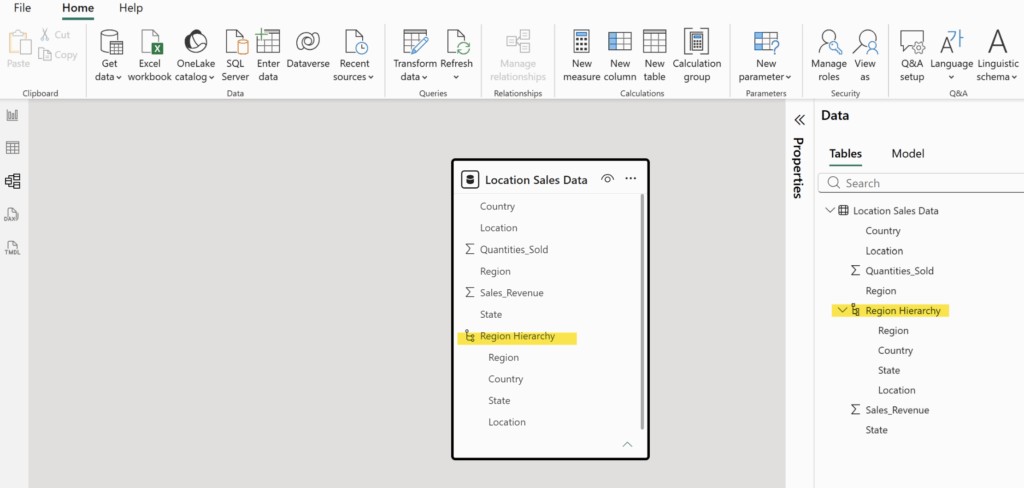
With just a few clicks, you’ve turned four separate columns into a single structured hierarchy column!
In the Report View in Power BI, you can now use the new Region Hierarchy field in any visual where the requirement is to see a metric by a location dimension. Power BI automatically enables its native drill-down feature for any visual using this hierarchy. This allows users to start with a high-level view like Sales by Region and instantly dive deeper into Sales by State, all within a single, dynamic visualization.
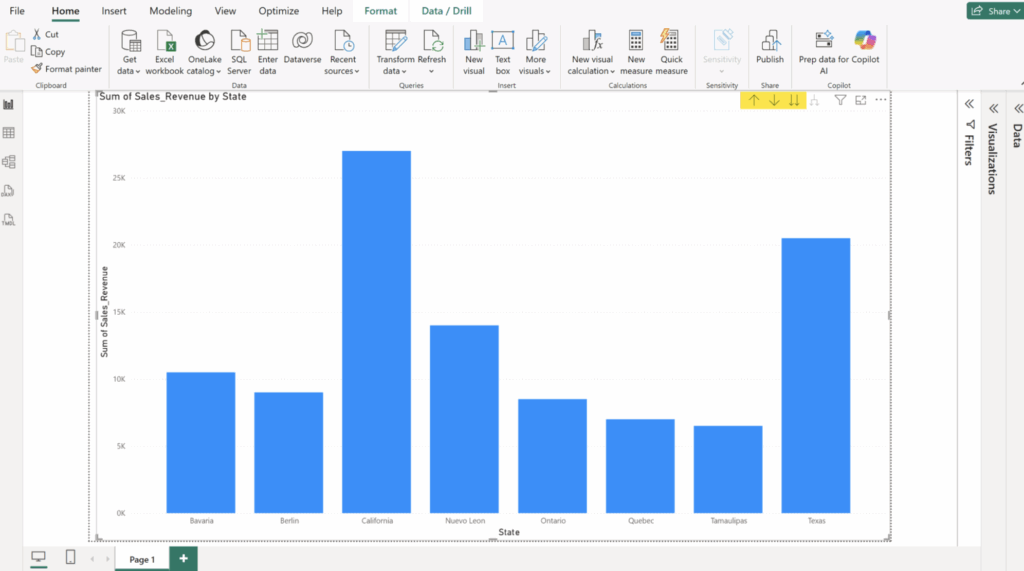
Building hierarchies inside of our data model will ultimately save critical dashboard real estate and allow you to easily build visuals for your audience that will avoid cognitive overload. Building a great data model doesn’t just mean storing data accurately, it means anticipating how users will interact with the data and structuring accordingly. Adding hierarchies to your data model ensures that you are designing a data model with the end user in mind, enabling them to interact with and consume the data in a logical and straightforward way.

Jeremiah Willett, CDMP: Empowering Smarter Decisions with Data
He is an Associate Manager of Data Engineering at Data Principles, where he helps organizations turn complex data into clear, actionable insights through innovative business intelligence solutions. With experience across SQL, Qlik Sense, data integration, and project management, he is passionate about empowering organizations to make data-driven decisions. Jeremiah also serves as the Vice President of Finance for DAMA Phoenix and holds a Certified Data Management Professional (CDMP) credential.
Join Our Data Community
At Data Principles, we believe in making data powerful and accessible. Get monthly insights, practical advice, and company updates delivered straight to your inbox. Subscribe and be part of the journey!